Table of Links
-
Introduction
1.1. Io as the main source of mass for the magnetosphere
1.2. Stability and variability of the Io torus system
-
Review of the relevant components of the Io-Jupiter system
2.1. Volcanic activity: hot spots and plumes
2.3 Exosphere and atmospheric escape
2.5. Neutrals from Io in Jupiter’s magnetosphere
2.6. Plasma torus and sheet, energetic particles
-
3.2 Canonical number for mass supply
3.3 Transient events in the plasma torus, neutral clouds and nebula, and aurora
3.4 Gaps in understanding, contradictions, and inconsistencies
-
Future observations and methods and 4.1 Spacecraft measurements
Appendix, Acknowledgements, and References
2.1. Volcanic activity: hot spots and plumes
The material that constitutes Io’s atmosphere, and that is ultimately lost from it, originates as molecules outgassed via volcanic activity. However, the path that gas takes from the moment it emerges from a volcanic vent to the time and place where it is lost from the upper atmosphere is far from clear. Moreover, while lava effusion should be accompanied by gas emission, and indeed all plumes observed by spacecraft are associated with thermal anomalies when observed with sufficient sensitivity, the association between lava flows and gas emission is complex. Earth-based observations, which are sensitive to the largest lava flows and gas plumes, find that the brightest hot spot thermal activity is not typically associated with the largest gas plumes, and vice versa. This finding has important ramifications. For example, changes in Loki Patera’s thermal emission are frequently attributed to the sinking of crust into a magma sea – not by gaseous plume eruptions (Matson et al., 2006; Rathbun and Spencer, 2006) – and so enhancements in the sodium nebula that were initially attributed to Loki Patera’s outgassing (Mendillo et al., 2004) are called into question. In this section, we review Io’s hot spot and plume activity, and we discuss what has been observed of the connections between hot spot activity and Io’s atmosphere, plumes, and mass loss. Note that “hot spot activity” here refers to the detection of enhanced thermal emission at the surface arising from volcanism; there may also be undetected subsurface thermal anomalies.
Broader reviews of Io’s hot spot and plume activity can be found in de Kleer and Rathbun (2023), de Pater et al. (2023), Williams and Howell (2007), and Geissler and Goldstein (2007) among others.
2.1.1 Io’s hot spot activity
Thermal emission from Io’s hot spots was seen by the Voyager spacecraft during their flybys of the Jupiter system in 1979 (Pearl and Sinton, 1982) and even before (Witteborn et al., 1979). When it can be localized, the thermal emission is associated with surface features seen in optical imagery, and the thermal behavior combined with the geological context indicate the most plausible style of volcanism at each site (e.g., Davies, 1996). Io hosts over 400 active volcanoes (Radebaugh et al., 2001; Williams et al., 2011) with over 250 of them active recently enough to still be producing thermal emission (Veeder et al., 2015; Cantrall et al. 2018). These occur predominantly in the form of lava lakes (Lopes et al., 2004; Radebaugh et al. 2004) and effusive lava flows, with occasional dramatic lava fountaining events (Keszthelyi et al., 2001). These volcanic types are analogous to the expressions of effusive volcanism observed on Earth, albeit much larger in scale (Davies et al., 2001; Davies, 2007). Thermal and visible observations suggest that Io’s magmas are of high-temperature mafic or ultramafic compositions (McEwen et al., 1998); such low-viscosity lava does not commonly produce explosive eruptions on Earth (although the difference in atmospheric pressure between Earth and Io also affects the explosivity of eruptions). Additionally, the enormous effusion rates of some of Io’s eruptions are not observed anywhere on Earth today.
Io’s hot spots are spatially-distributed across Io and exhibit a high degree of temporal variability, which can be used to search for connections between thermal volcanic activity and gas input into the atmosphere or even the Jovian environment. Io’s hot spots are classified as either persistent or transient. Persistent hot spots exhibit thermal emission consistently and typically do not exhibit large-scale transient events, whereas transient hot spots are not consistently active but do exhibit large-scale transient events (e.g., Lopes-Gautier et al., 1999; de Kleer and de Pater, 2016a). Events of very strong and usually transient thermal emission were dubbed ‘outbursts’ in the literature (e.g., Veeder et al., 2012). They have an eruptive power that is more than an order of magnitude higher than Io’s typical volcanic hot spot. A handful of sites (e.g., Loki Patera, Pillan Patera and Pele) are known to fall into both categories (both persistent and transient hot spot activity); observations are limited so this may in fact be more common.
If bright, transient thermal events occur because of pressure build-up in a subsurface magma system leading to eruption, then transient volcanoes might be expected to produce more gas than persistent volcanoes. At more persistently-active sites, magma may be either already degassed or may produce plumes by simply sublimating SO2 at a slow but steady rate as lava fronts advance across the frost patches.
The relation between lava lakes and plumes is not straightforward: intuitively, a passively-cooling lava lake is unlikely to produce a gas plume, but an active lava lake connected to a deep magma reservoir could. In practice, large plumes have indeed been seen associated with lava lakes, for example at Pele (Davies et al., 2001).
If volcanic gases are lost from the atmosphere close to where they are emitted, then certain volcanoes, or even eruptions that take place at certain times of the day, may preferentially contribute to mass loss as the effects of the plasma on the atmosphere varies with surface location and time of day (see Section 2.4. on the plasma interaction.).
Between 2013 and 2022, detected bright transient thermal events have occurred preferentially on Io’s trailing hemisphere (de Kleer et al., 2019; Tate et al., 2023). The (sparser) data prior to 2012 do not show this preference as clearly (Tate et al., 2023), but the distribution of large red plume deposits associated with bright transient events do follow this same distribution (McEwen and Soderblom, 1983).

2.1.2. Dust and gas plumes
Volcanic plumes on Io are mostly observed through visible light scattering by entrained dust particulates with grain sizes estimated to be in the range of tens to hundreds of nanometers (Figure 3 left; Geissler and Goldstein, 2007; Geissler and McMillan, 2008). Plume gases can be identified in eclipse observations, when localized electron-impact excited (auroral-like) emissions are seen above volcanic sites in spacecraft images (Figure 3 middle; Geissler et al., 2004; 2007; Spencer et al., 2007; Roth et al., 2011). In addition, transit spectroscopy of Pele’s plume on Io’s limb against Jupiter by the Hubble Space Telescope (HST) allowed measurements of S2 and SO2 plume-only gases (Figure 3 right; Spencer et al., 2000; Jessup et al. 2007). Signals from other molecular species, which can only be explained to be produced in active plume outgassing, are also observed (Section 2.1.3). Dust to gas ratios in the range of 10-1 to 10-2 were inferred from HST images of dust reflections and gas absorptions in large plumes (Jessup and Spencer, 2012). Generally, observations of scattered light by dust grains are primarily used to detect and characterize plumes and measurements of the gas components are often not available, allowing for higher dust to gas ratios in principle. The observed plumes mirror the dichotomy seen in the surface thermal emissions (Section 2.1.1), with long-lived small “Prometheus-type” plumes and short-lived large “Pele-type” plumes (McEwen and Soderblom, 1983). Pele’s plume now appears to have been long-lived but with a short phase in which it was easily visible.
In contrast, Prometheus-class plumes are lower energy and typically extend to less than 100 kilometers as seen in visible wavelengths. They might be more heavily-particulate mass loaded, and probably arise from an interaction of surface lava flows with pre-existing volatile frost/ice deposits (Milazzo et al., 2001). The apparent origin of the Prometheus plume itself shifted roughly 60 km between Voyager and Galileo observations, presumably as a lava front advanced, but the plume has been observed to persist to the present as seen in the recent Juno images[1].
Different indications of possible wide outgassing, which could not be directly observed, led to the suggestion of a third class of plumes dubbed stealth plumes, which contain gas but very few or no particulates such that they remain undetected in scattered light images (Johnson et al., 1995). Gas emissions from a possible stealth plume might have been observed in an eclipse image by New Horizons above the East Girru hot spot, which had no associated dust plume in sunlight (Spencer et al., 2007). De Pater et al. (2020) propose that the SO emissions observed with the Keck telescope are likely caused by a large number of such stealth plumes.
2.1.3 Linking hot spot activity to outgassing at plumes

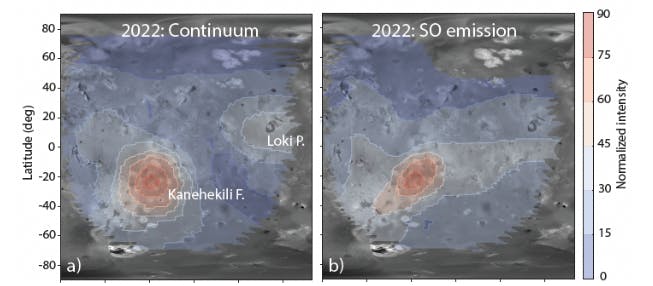
The case appears to be similar for NaCl and KCl gas. These gases should have at most a lifetime of a few hours in the atmosphere of Io (Moses et al., 2002). They are detected only in localized regions (Redwing et al., 2022; de Kleer et al., in review) via rotational transitions at millimeter wavelengths. The gas temperature based on both line widths and molecular state populations is much higher than that of SO2 in the same observations. For all practical purposes, NaCl and KCl are solids below 1000 K (Chickos and Acree, 2003). However, when the observations reveal a localized distribution, the NaCl and KCl gases are not spatially-correlated with highly (currently) active hot spot emissions, and simultaneous ALMA sub-mm gas and Keck near-infrared thermal imagery show a lack of spatial correspondence (Figure 5). Thus, if the alkali gases are tracers of plumes, then such plumes are not typically associated with thermal emission at a magnitude that can be seen from Earth. Equally intriguing is the absence of a spatial correlation between NaCl/KCl and SO2 gases, discussed in Section 2.2.2.

However, there are several cases where volcanic sites could be associated with gas output during their thermal eruptions (hot spot activity). The New Horizons spacecraft observed emissions from excited plume gases in eclipse and colocated dust plumes over simultaneously imaged hot spots at several locations including Tvashtar Catena with a large plume (Spencer et al., 2007; Roth et al., 2011). Prominent dust plumes were detected in optical images at locations of thermal emission, for example at the volcanoes Loki and Pele as observed by Voyager (Strom et al., 1981). The plume gas abundance at the locations, however, was not constrained simultaneously but instead only studied at other times (e.g., Jessup et al., 2007). The lack of observed correspondence between near-infrared thermal emission and gas emission from high-temperature tracers like SO, NaCl, and KCl or plume-only bulk gases thus remains an area where our understanding is incomplete.
2.1.4 Linking hot spot activity to transient torus events
Transient brightening events observed in the systems of the torus plasma and the neutral clouds and nebulae around Jupiter (Sections 2.5 and 2.6) have long been attributed to gas output from volcanic eruptions on Io, although the observational evidence for this link remains tenuous.
The brightening in S + torus ion and Na neutral emission observed in 1991 was attributed to a putative volcanic outburst on Io (Brown and Bouchez, 1997), which was not directly identified. Mendillo et al. (2004) investigated the correspondence between 3.5 micron hotspot emission on Io’s sub-Jovian hemisphere and annual measurements of Na emission from the extended nebula (out to hundreds of Jovian radii) over the period from 1990 to 1998. They found a correlation between Na nebula brightness and activity at Loki Patera, as well as with a thermal outburst event fortuitously detected at Tiermes Patera during this time. However, both datasets are temporally sparse and would generally not be sensitive to variations on timescales of days to weeks. In addition, the hot spot dataset is only sensitive to the sub-Jovian hemisphere and lacks direct spatial resolution, permitting detection of only the brightest eruptions and only when located on the sub-Jovian hemisphere. More recent datasets with much higher cadence and more comprehensive Io surface coverage do not find such a clear correlation, especially with Loki Patera (de Kleer & de Pater, 2016a; Yoneda et al., 2015). It is unclear whether the apparent correlation observed between 1990 and 1998 was the result of sparse data, or whether Loki Patera (and potentially other IR-bright volcanoes) changed their behavior between the 1990s and the 2000s.
During the spring of 2015, when neutrals, ions and hot spots were all being observed at a higher cadence than ever before, a major brightening was observed in the Na nebula accompanied by an O and S ion and neutral response (Yoneda et al., 2015; Tsuchiya et al., 2018; Koga et al., 2018b). Hot spot activity at different sites including some brighter events were also observed during spring 2015 (de Kleer and de Pater, 2016a). The torus brightening has most commonly been associated with a large enhancement in thermal emission from Kurdalagon Patera, though the association is complicated and was mostly based on a presumably temporal coincidence. The Na nebula brightening began before near-infrared emissions at Kurdalagon Patera reached a detectable level and right after a moderate brightening was detected at Mithra Patera (see Figure 6). Moreover, Kurdalagon Patera dimmed significantly in the middle of the Na brightening (when Pillan Patera was the most active hot spot), and brightened again two months later without detectable brightening of the Na. Altogether, it is not clear if and how any of the observed hot spot activity during spring 2015 had a (causal) relationship to the 2015 torus event.

[1] https://www.nasa.gov/missions/juno/nasas-juno-to-get-close-look-at-jupiters-volcanic-moon-io-on-dec-30
Authors:
(1) L. Roth, KTH Royal Institute of Technology, Space and Plasma Physics, Stockholm, Sweden and a Corresponding author;
(2) A. Blöcker, KTH Royal Institute of Technology, Space and Plasma Physics, Stockholm, Sweden and Department of Earth and Environmental Sciences, Ludwig Maximilian University of Munich, Munich, Germany;
(3) K. de Kleer, Division of Geological and Planetary Sciences, California Institute of Technology, Pasadena, CA 91125 USA;
(4) D. Goldstein, Dept. Aerospace Engineering and Engineering Mechanics, The University of Texas at Austin, Austin, TX USA;
(5) E. Lellouch, Laboratoire d’Etudes Spatiales et d’Instrumentation en Astrophysique (LESIA), Observatoire de Paris, Meudon, France;
(6) J. Saur, Institute of Geophysics and Meteorology, University of Cologne, Cologne, Germany;
(7) C. Schmidt, Center for Space Physics, Boston University, Boston, MA, USA;
(8) D.F. Strobel, Departments of Earth & Planetary Science and Physics & Astronomy, Johns Hopkins University, Baltimore, MD 21218, USA;
(9) C. Tao, National Institute of Information and Communications Technology, Koganei, Japan;
(10) F. Tsuchiya, Graduate School of Science, Tohoku University, Sendai, Japan;
(11) V. Dols, Institute for Space Astrophysics and Planetology, National Institute for Astrophysics, Italy;
(12) H. Huybrighs, School of Cosmic Physics, DIAS Dunsink Observatory, Dublin Institute for Advanced Studies, Dublin 15, Ireland, Space and Planetary Science Center, Khalifa University, Abu Dhabi, UAE and Department of Mathematics, Khalifa University, Abu Dhabi, UAE;
(13) A. Mura, XX;
(14) J. R. Szalay, Department of Astrophysical Sciences, Princeton University, Princeton, NJ, USA;
(15) S. V. Badman, Department of Physics, Lancaster University, Lancaster, LA1 4YB, UK;
(16) I. de Pater, Department of Astronomy and Department of Earth & Planetary Science, University of California, Berkeley, CA 94720, USA;
(17) A.-C. Dott, Institute of Geophysics and Meteorology, University of Cologne, Cologne, Germany;
(18) M. Kagitani, Graduate School of Science, Tohoku University, Sendai, Japan;
(19) L. Klaiber, Physics Institute, University of Bern, 3012 Bern, Switzerland;
(20) R. Koga, Department of Earth and Planetary Sciences, Nagoya University, Nagoya, Aichi 464-8601, Japan;
(21) A. McEwen, Department of Astronomy and Department of Earth & Planetary Science, University of California, Berkeley, CA 94720, USA;
(22) Z. Milby, Division of Geological and Planetary Sciences, California Institute of Technology, Pasadena, CA 91125 USA;
(23) K.D. Retherford, Southwest Research Institute, San Antonio, TX, USA and University of Texas at San Antonio, San Antonio, Texas, USA;
(24) S. Schlegel, Institute of Geophysics and Meteorology, University of Cologne, Cologne, Germany;
(25) N. Thomas, Physics Institute, University of Bern, 3012 Bern, Switzerland;
(26) W.L. Tseng, Department of Earth Sciences, National Taiwan Normal University, Taiwan;
(27) A. Vorburger, Physics Institute, University of Bern, 3012 Bern, Switzerland.